Using the AirPOS Reports App on your iPhone
When you've downloaded and installed the application from the App Store an icon like that in the image below will appear on your phone's home screen. Just click on it to open.

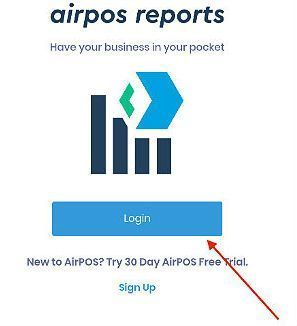
When you open the Reports application you'll see a login button.
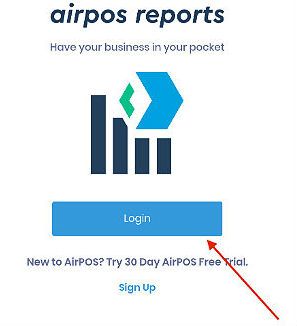
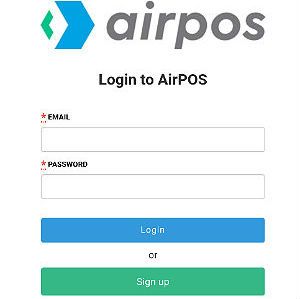
Tap on 'Login' and enter the email and password credentials that you use for logging in to the POS application and the backoffice.
When the application opens you'll see the reporting 'Dashboard as seen below.
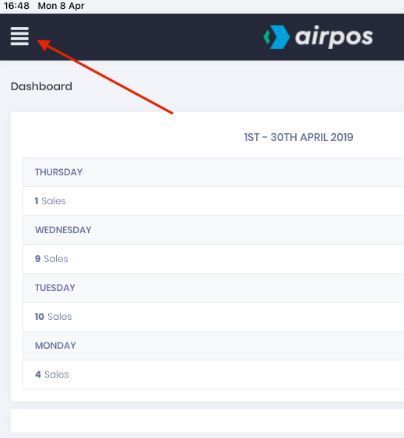
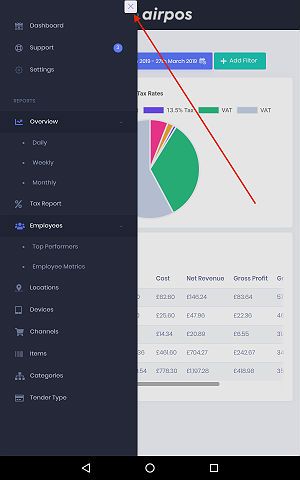
At the top right of the screen if you tap on the four horizontal bars you'll see a side menu.
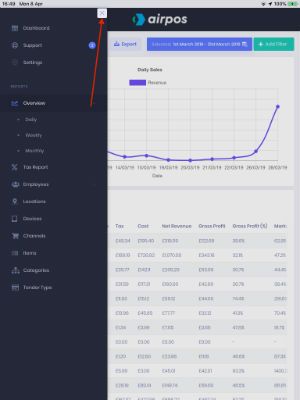
If you tap on the white 'X' at the top middle of the screen you can hide the side menu and if you tap in the daterange box you can specify the daterange that you want any report you run to cover.
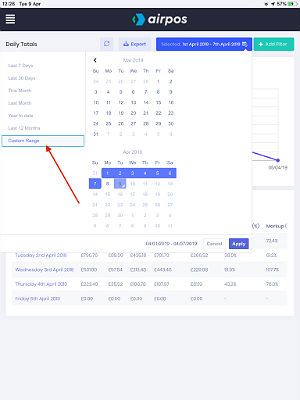
A drop down list of options are available. In the example below we've selected the option to 'Custom Range' and have selected the first week of April.
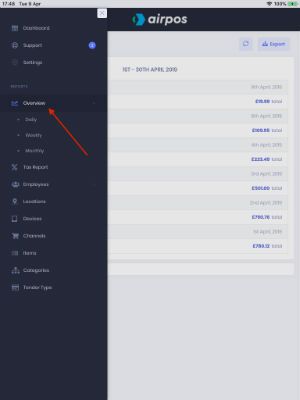
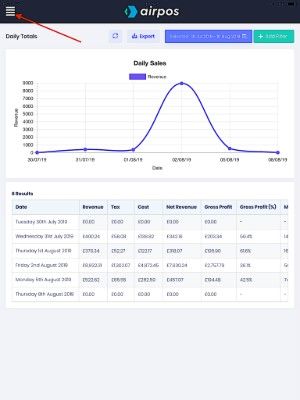
We'll first take a look at the daily overview for March. To do that tap on 'Overview'. The menu will expand to show Daily, Weekly and Monthly. Tap on Daily as shown below.
Tap on the 'X' at the middle top to close the side navigation menu and tap in the daterange box. A drop down list of options will appear. Select the option for 'Last Month'.
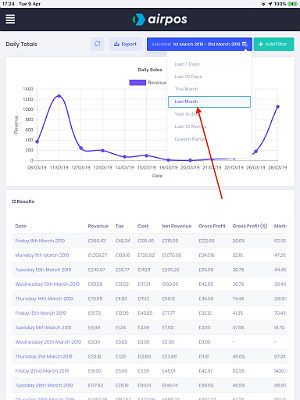
As in the Backoffice when viewing reports you'll see a graphical representation showing your daily sales for the month with a table of sales data below. This data can be exported as a .CSV file by tapping on the 'Export' button to the left of the daterange box at the top of the screen and the exported data will be emailed to the email address of the account.
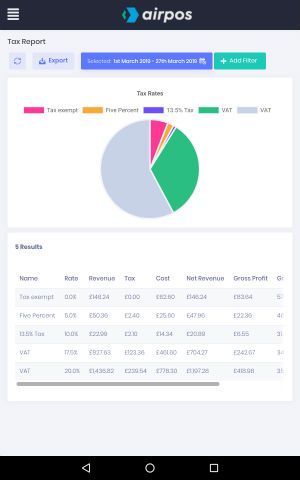
We're next going to look at a tax report for the same period. Tap on the horizontal bars at the top left of the screen to open the side menu and select 'Tax report'. You'll see a screen like that below.
Tap on the white 'X' at the middle top of the screen to close the side menu and view your tax report for this month.
To look at a report of sales by employees again tap on the horizontal bars at the top left of the screen. If you tap on 'Employees' you'll see that there are two reports available. If you tap on 'Top Performers' you'll see a screen like that below for the current month showing your top performers in a bar chart with a table below showing all sales by all employees.
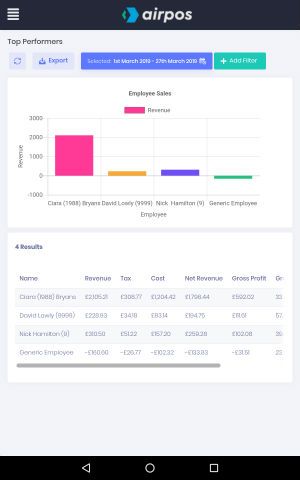
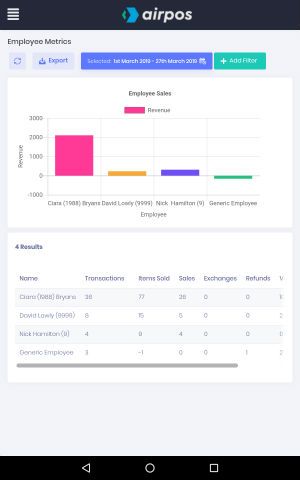
The other employees sales report is 'Employee Metrics' which shows the total number of sales, refunds, discounts and voids made by each employee within the daterange.
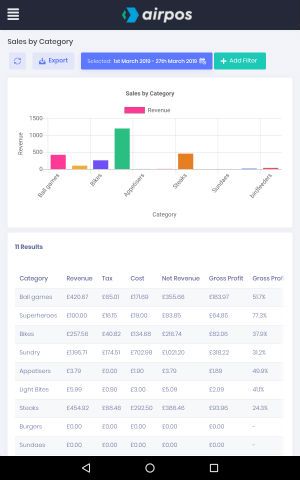
By Tapping on 'Categories' from the menu in the left navigation you can quickly view a report of sales by category.
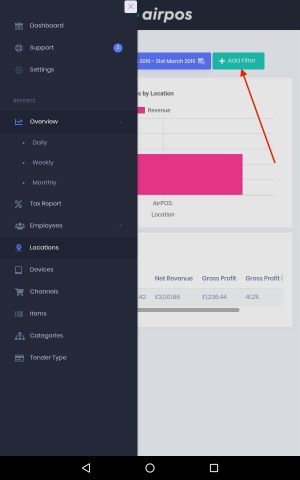
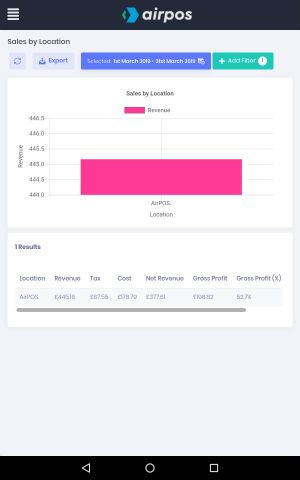
As with your 'Reports' in your backoffice you can add filters to your reports. For example if we want a report of sales by location in March but only of products within the 'Ball Games' category the first thing is to set the date then select 'Location' from the menu on the left. Then tap on the green '+ Add Filter' button.
A dropdown list of filterable aspects will be shown. Tap on Categories and start to type 'Ball Games'.
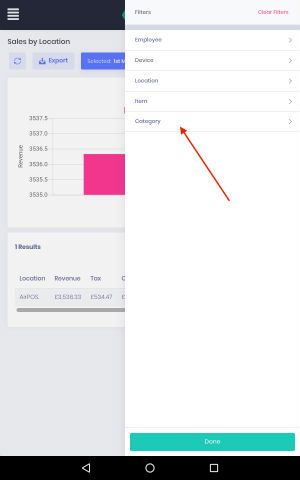
The app will natively search as you type and when you see the category you want tap on it to set the filter
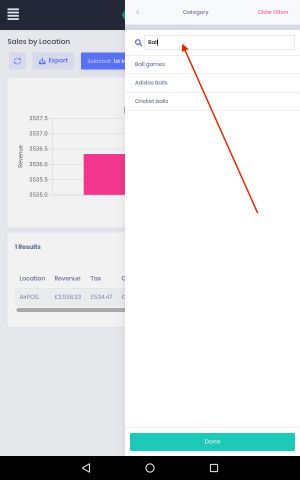
Tap on the 'Done' button and you'll see your filtered report.
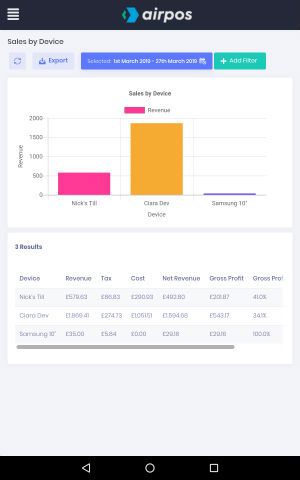
With the new mobile reports app you can also quickly view a report of sales by the device they were made on.
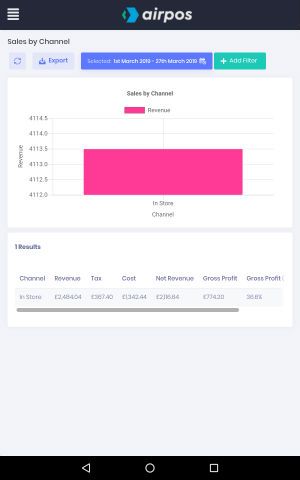
Or you can compare the sales made in March in Store with those made online in a report of sales by Channel. For the month of March all sales were made in store as seen below.
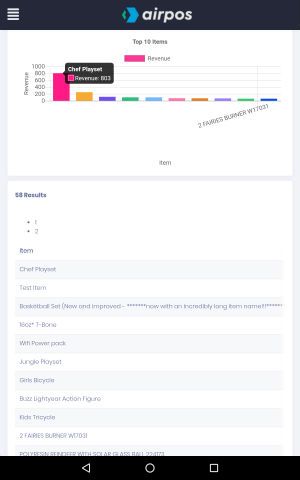
You may wish to see at a glance what your best selling products have been for the month. Tap on the horizontal bars from the top left of the application and select 'Items'. Tap on the 'X' at the top middle to hide the menu and your best selling top ten items will be shown in a bar chart with a table below showing all items sold.
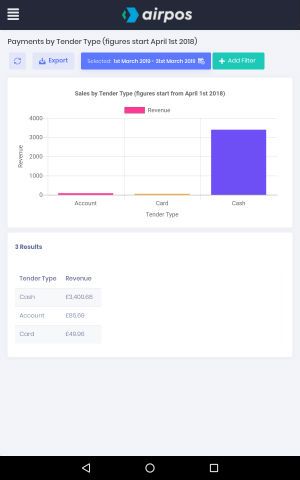
To run a report of sales by tender type again tap on the three horizontal bars at the top left of the application and select 'Tender Type' from the menu displayed on the left. Tap on the 'X' at the middle top to hide the menu and you'll see a report of sales by card, cash etc.
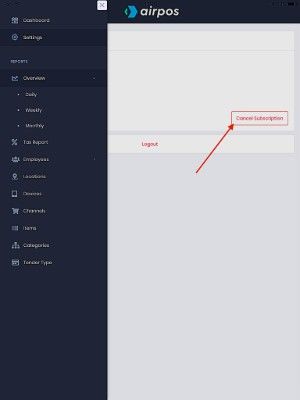
To unsubscribe from the Reports App tap on the four horizontal bars in the top right corner of the screen.
Tap on 'Settings' as shown below.

You'll see a red button to 'Cancel Subscription'. Just tap on that.