How To Generate Reports on Your Sales Per Device
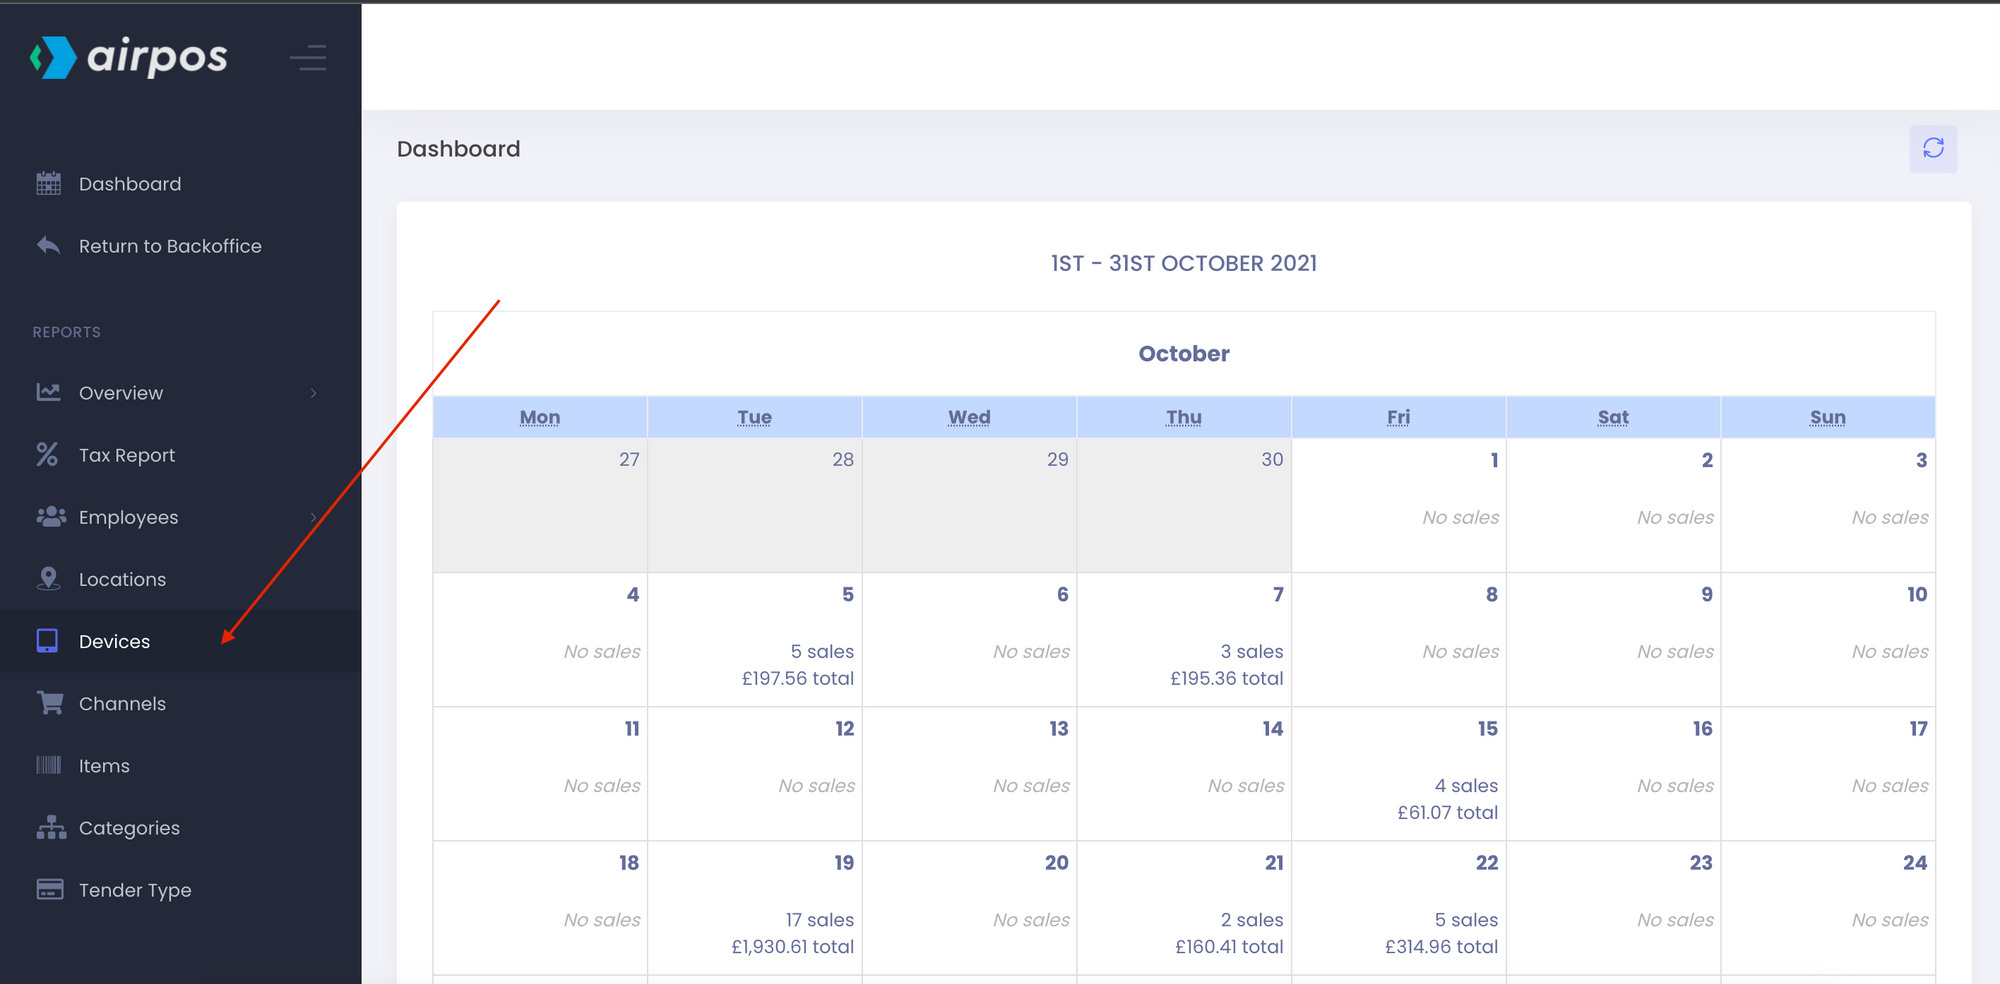
You can view your sales by device by selecting ‘Reports’ from the left navigation panel of the backoffice. This will present you with a calendar view of the current month's sales.
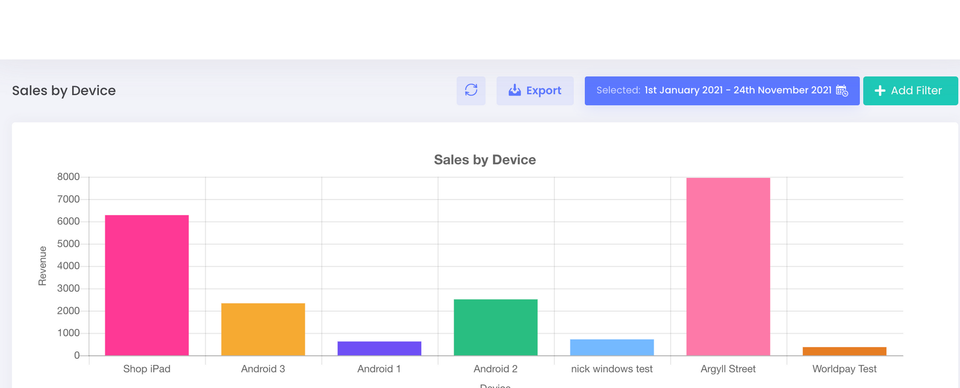
If you click on devices from the left navigation panel, under reports in the backoffice you will be presented with a bar chart showing sales by all of your devices or tills.
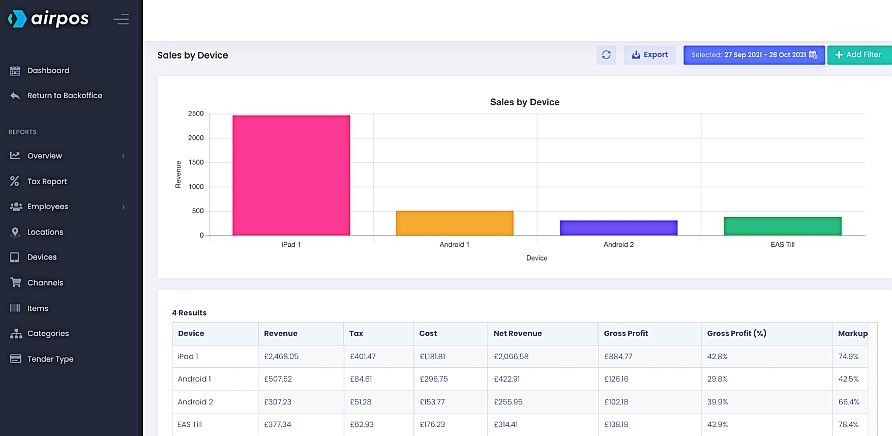
Directly below all the sales data relevant to each device will be presented in tabular format which can be exported to a .CSV file by pressing the green ‘Export’ button at the top of the screen. The data will include the total revenue generated by each device, the total tax, cost, and the net revenue. The gross margin and profit margin as a percentage also will be calculated and exposed in this table.
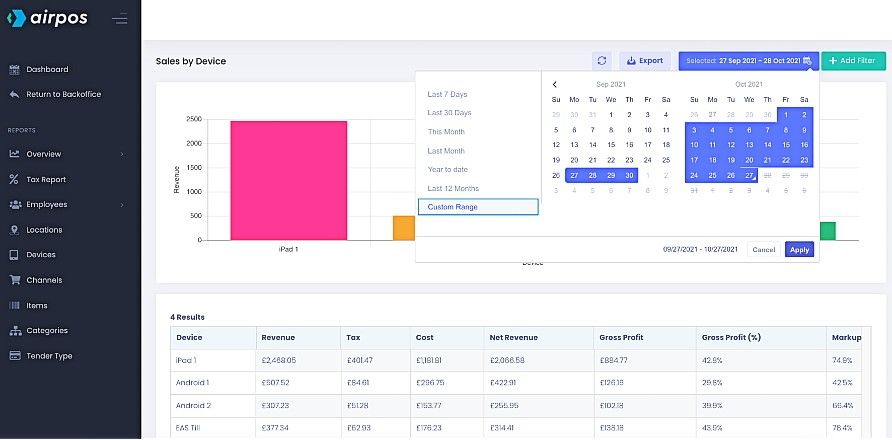
When you click or tap in the date range box at the top of the screen beside the button to 'Export' the data, you'll see there are a number of pre-set date ranges such as the last 7 days, the last month, this month etc or you can customise the daterange by selecting the dates from the calendars side by side.