How to Generate a Tax Report.
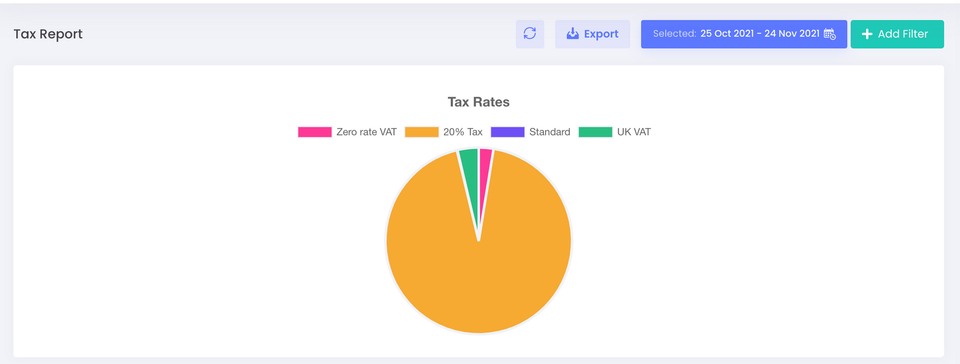
Among the many reports you can run with the advanced reporting suite is the tax report. This features a pie chart showing all the tax rates that you have set up in the backoffice.
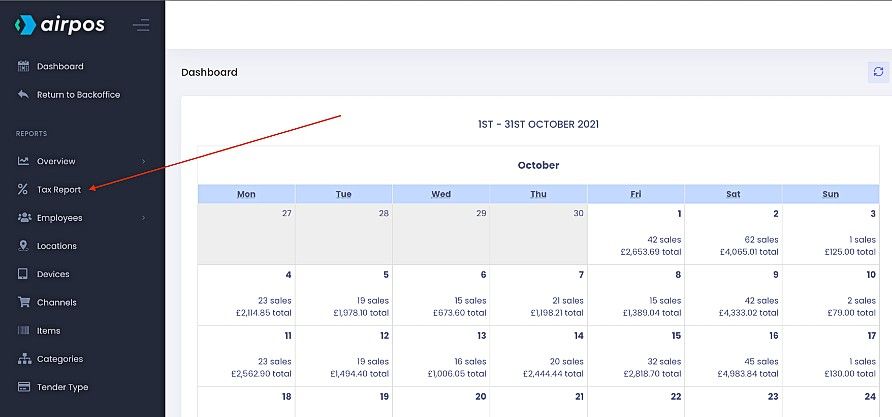
You can view your sales by channel by clicking on ‘Reports’ from the left navigation panel of the backoffice. This will present you with a calendar view of the current month's sales.
When you select 'Tax Report' from the menu on the left you'll see a pie chart of all sales made for each tax rate. As with all the reports the data is reproduced in a table below the chart and can be exported to a .CSV file by pressing the ‘Export’ button at the top of the screen.
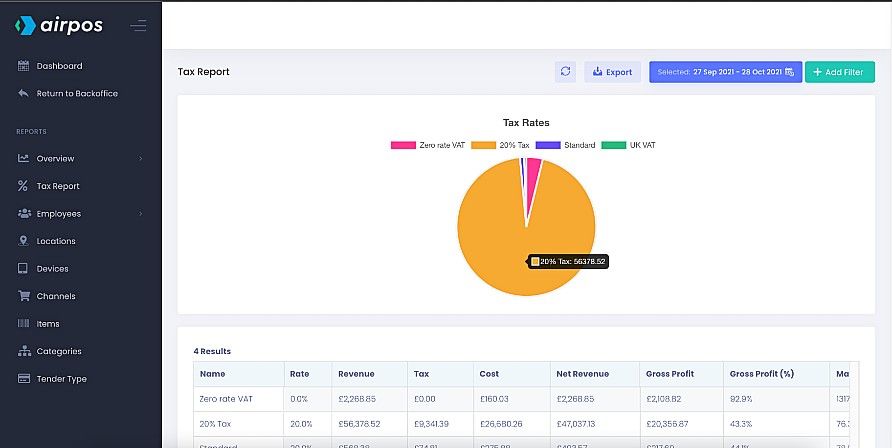
The table shows the rate of tax for each tax band, the total revenue generated at each tax band, the amount of tax paid, the total cost of inventory and the net revenue. It also shows the gross margin and the profit margin as a percentage.
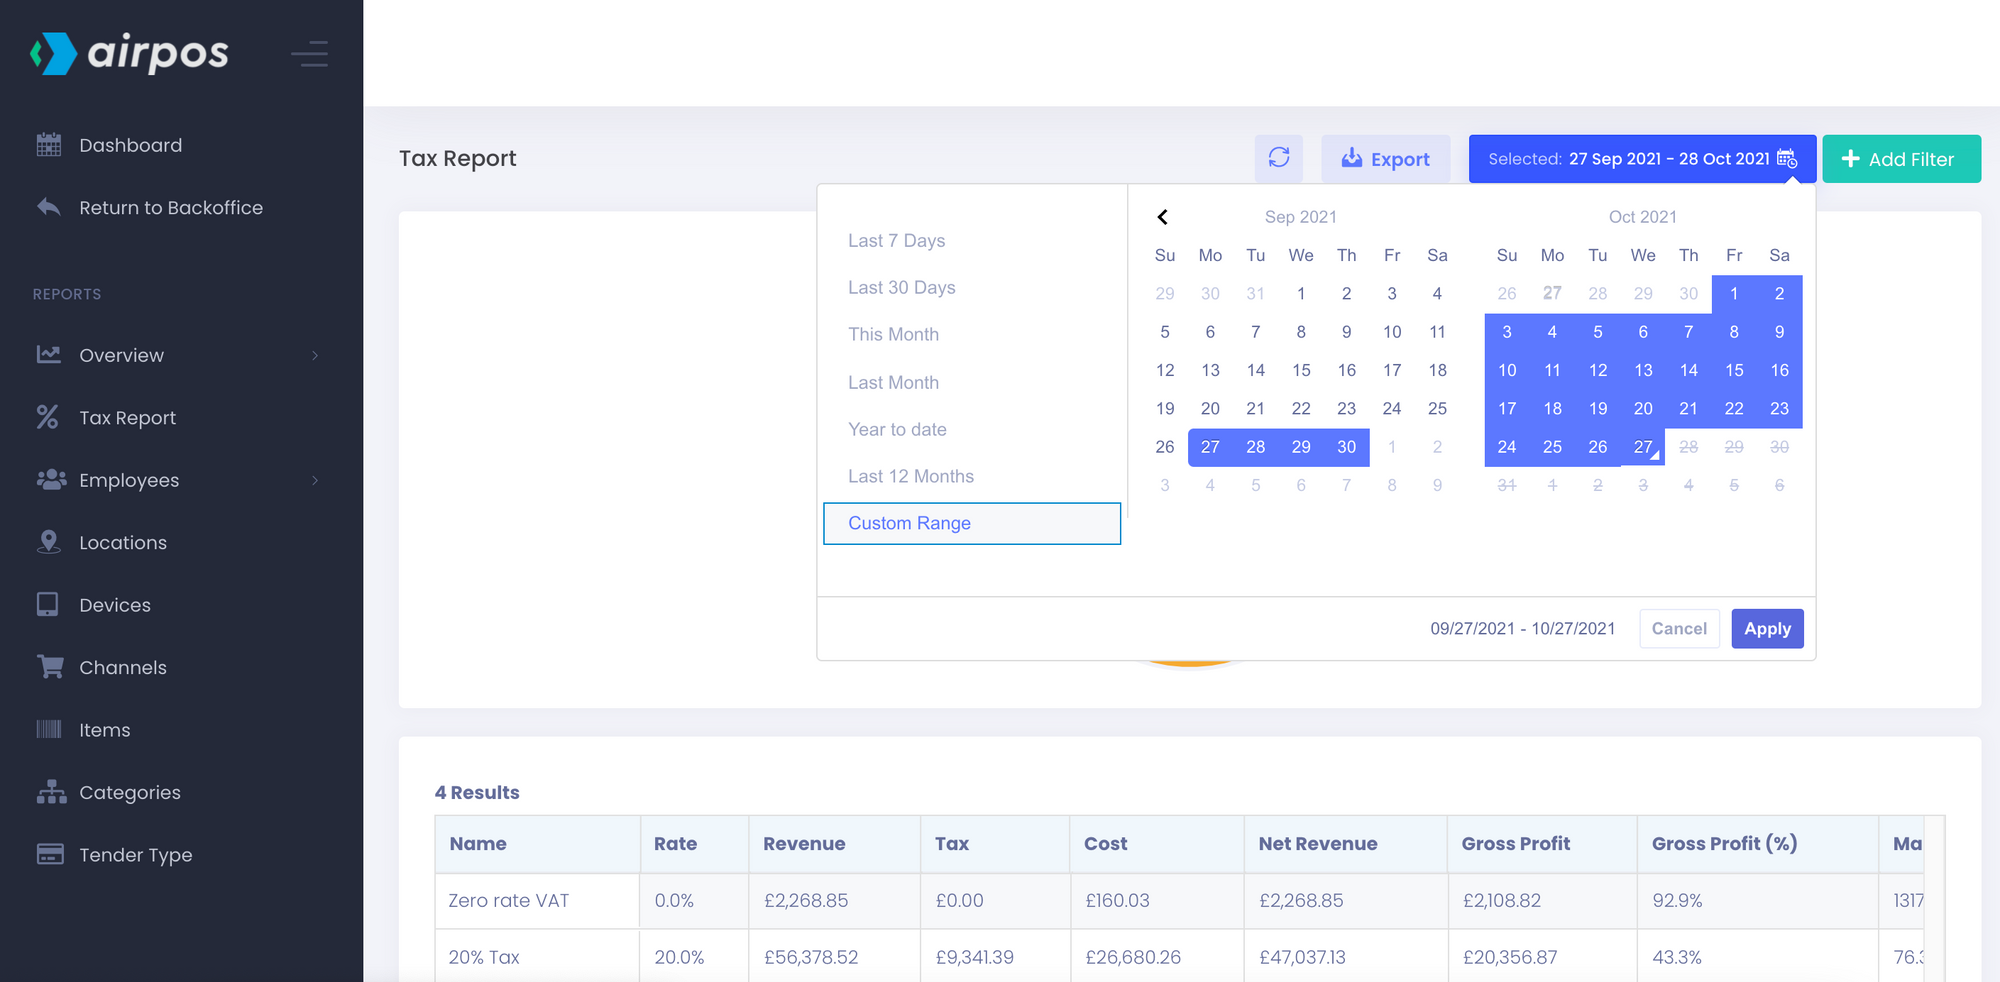
When you click or tap in the 'date range' box at the top of the screen, beside the button to 'Export' the data, you'll see there are a number of pre-set date ranges such as the last 7 days, the last month, this month etc or you can customise the date range by selecting the dates from the calendars side by side.