How to Generate a Report of Your Sales Per Location
You can view your sales by channel by clicking on ‘Reports’ from the left navigation panel of the backoffice. This will present you with a calendar view of the current month's sales.
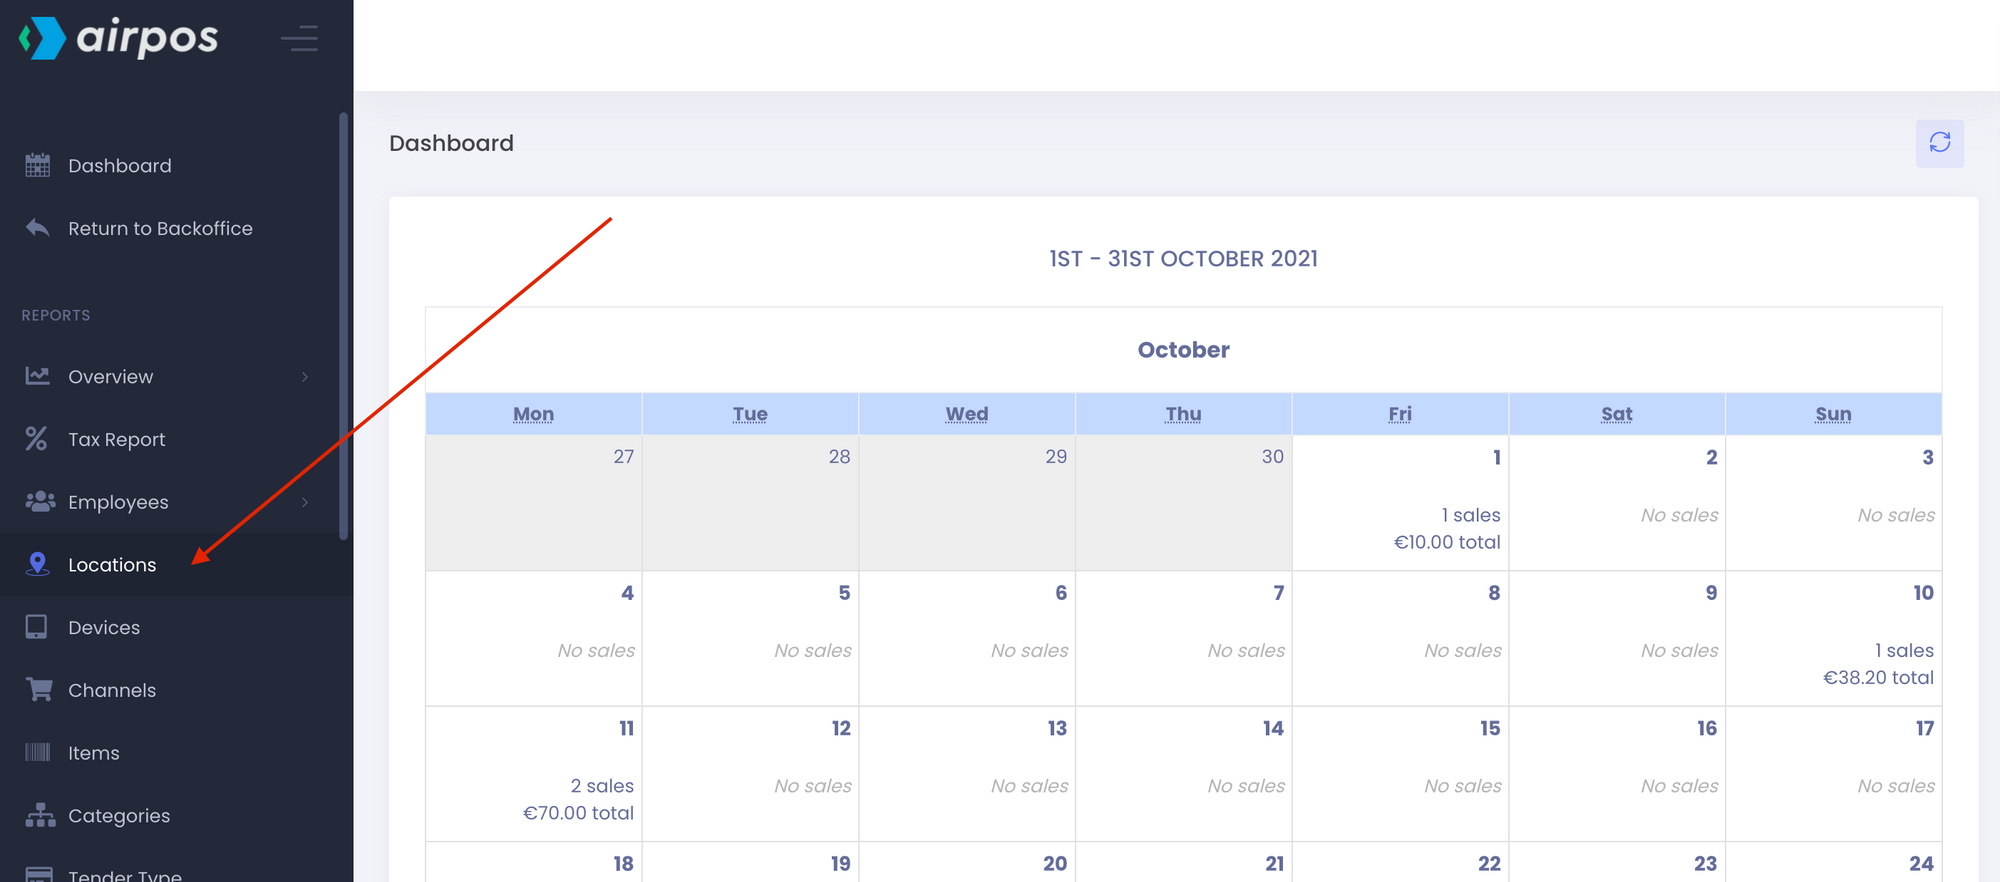
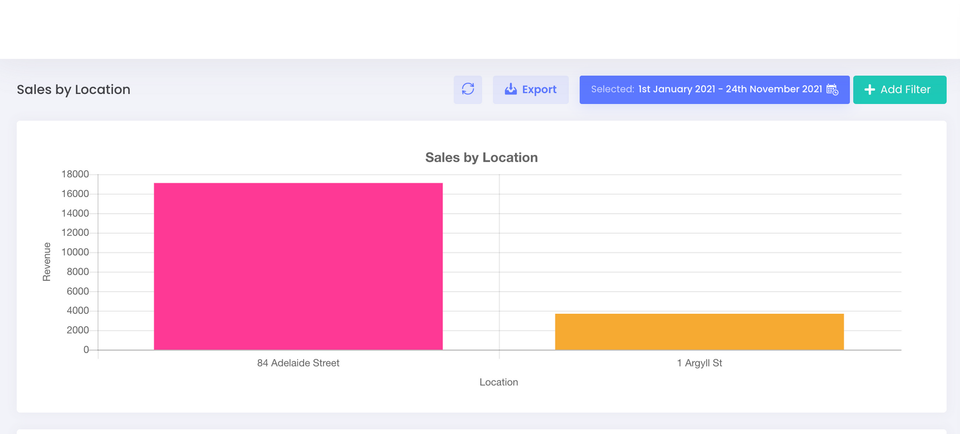
Select 'Locations' from the reports menu on the left. You'll see a bar chart of sales made at each location you have. The data is shown in a table below which can be exported as a .CSV file and opened in a spreadsheet to expose such data as total revenue for each location, total cost of items sold at each location, tax, net revenue, gross margin and percentage profit by location.
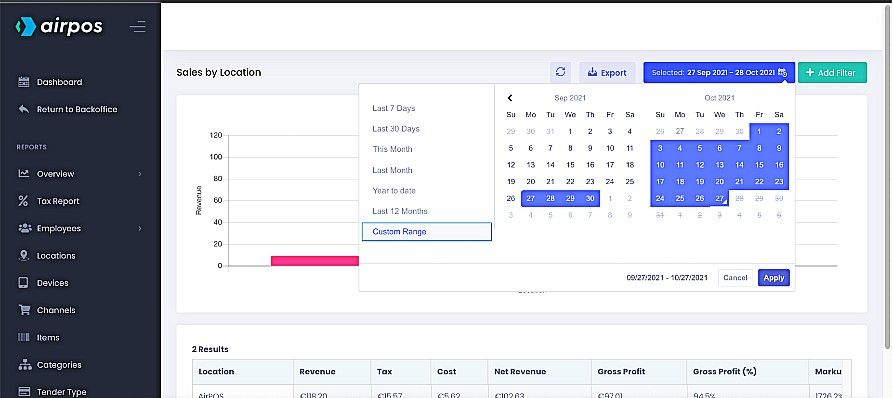
When you click or tap in the date range box at the top of the screen beside the button to 'Export' the data you'll see there are a number of pre-set date ranges such as the last 7 days, the last month, this month etc or you can customise the date range by selecting the dates from the calendars side by side.