How to View Your Top Selling Items in AirPOS Reports App
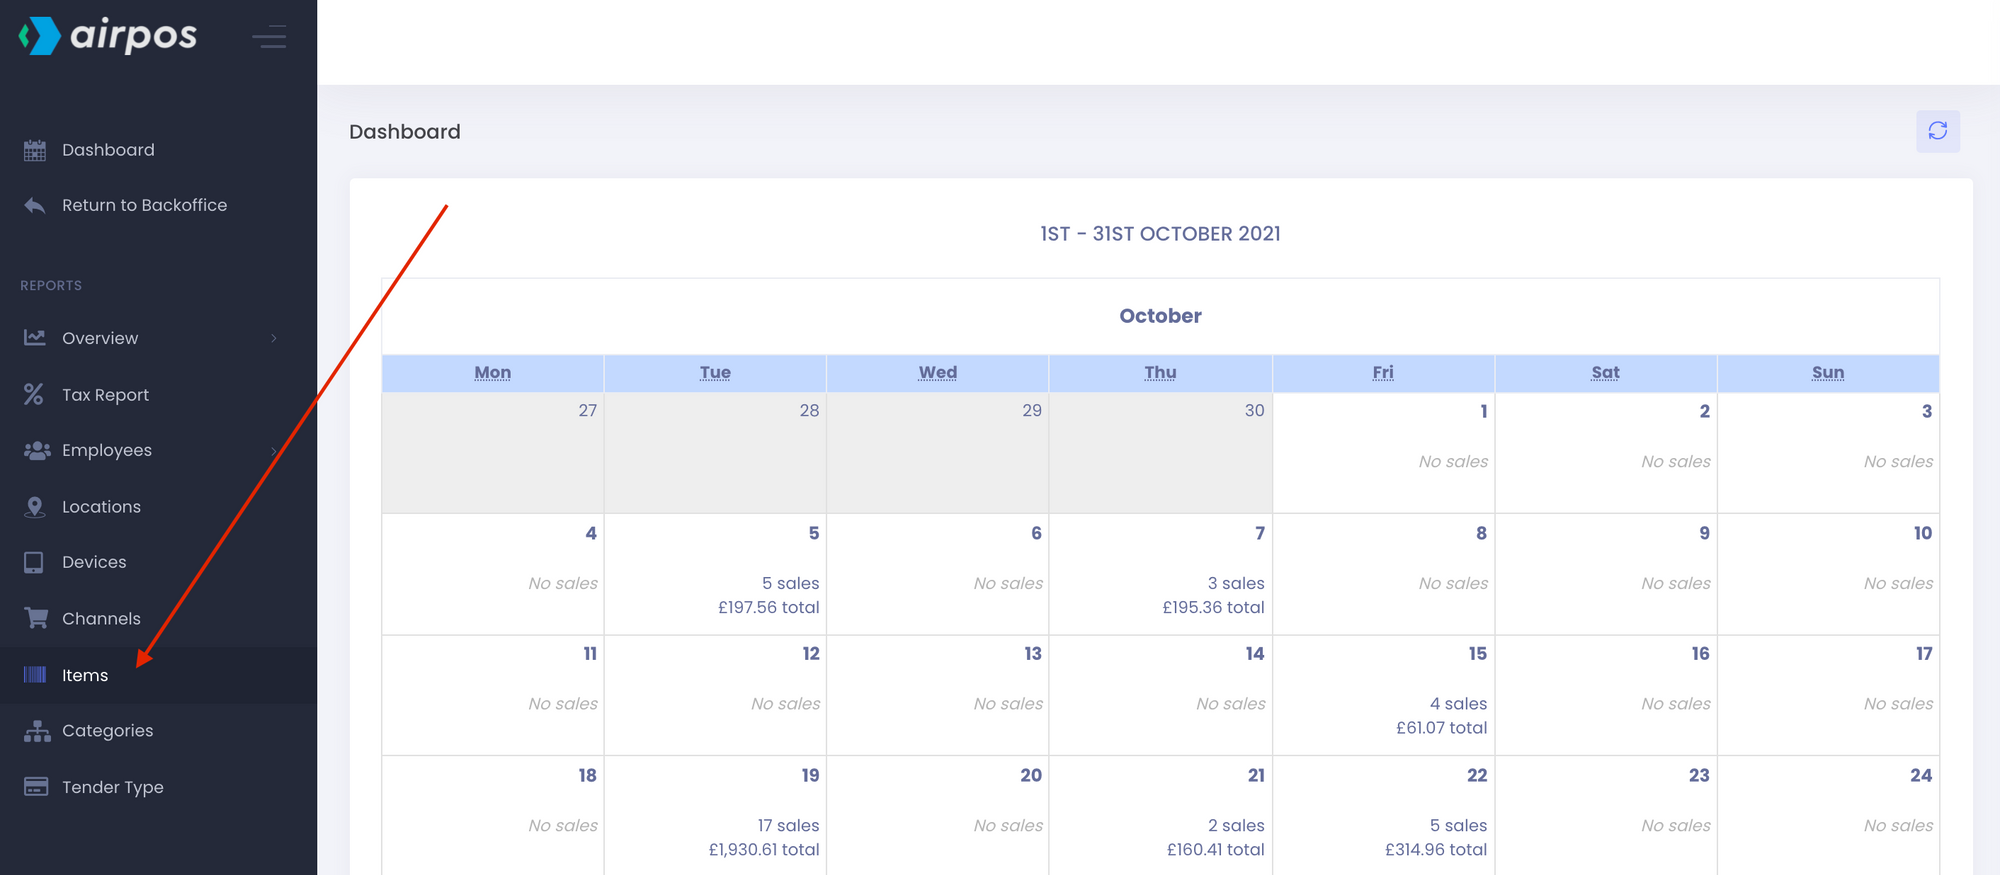
You can view your top selling products by selecting ‘Reports’ from the left navigation panel of the backoffice. This will present you with a calendar view of the current month's sales.
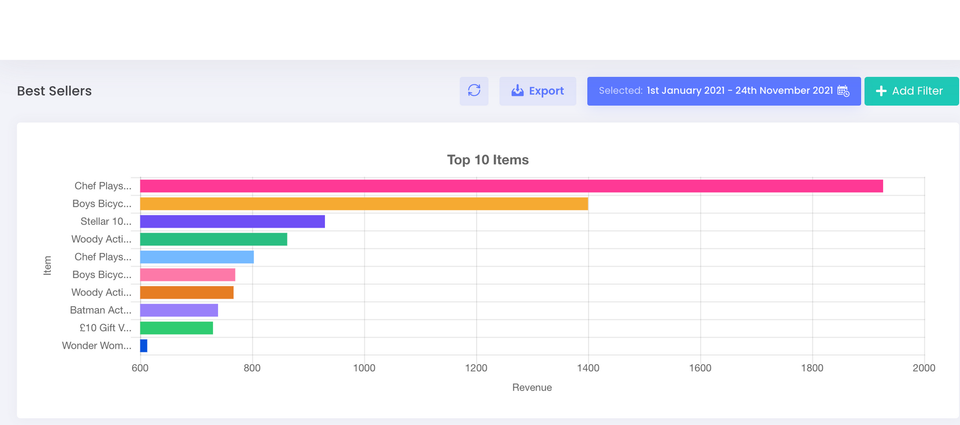
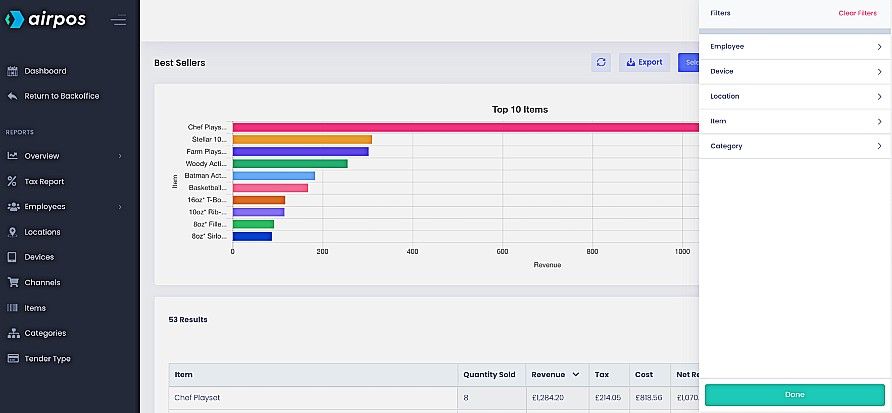
If you select 'Items' from the reports menu on the left you'll see a comparative bar chart of your top ten selling products. Below the bar chart is table of the sales of every product that you've sold within the date range at the top of the screen. This data can be exported to a.CSV file by pressing the 'Export' button beside the date range.
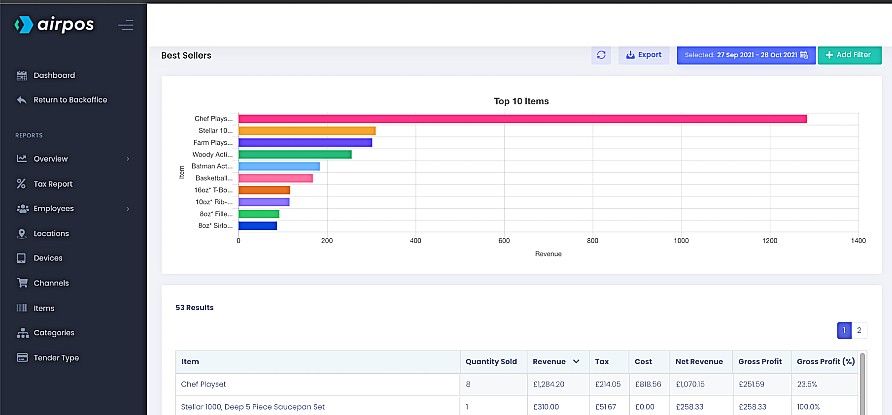
The items are arranged with the top sellers in terms of revenue at the top of the table. This table includes information such as the quantity of items sold (useful for stock keeping purposes), the total revenue from each item or product, the tax paid, the total cost price, the gross margin and the profit margin as a percentage.
It may be that you want a report of your top selling products at one of your locations. This can be done by filtering the report. Tap on the green '+ Add Filter' button at the top of the screen. You'll see a dropdown list of filters.
Select 'Location' and the dropdown list will be refined to show your locations.
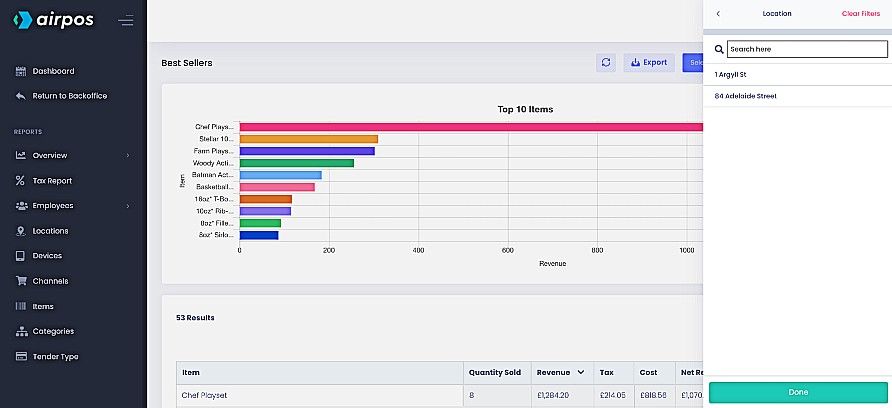
Select the location for which you want the report and press the 'Done' button at the bottom of the dropdown.
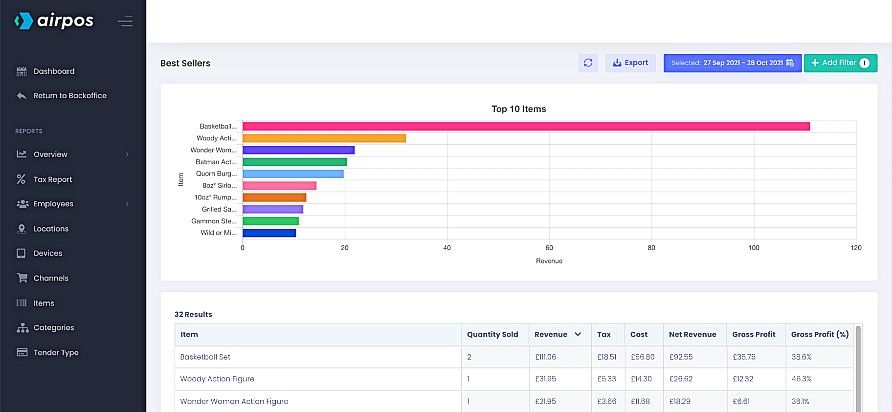
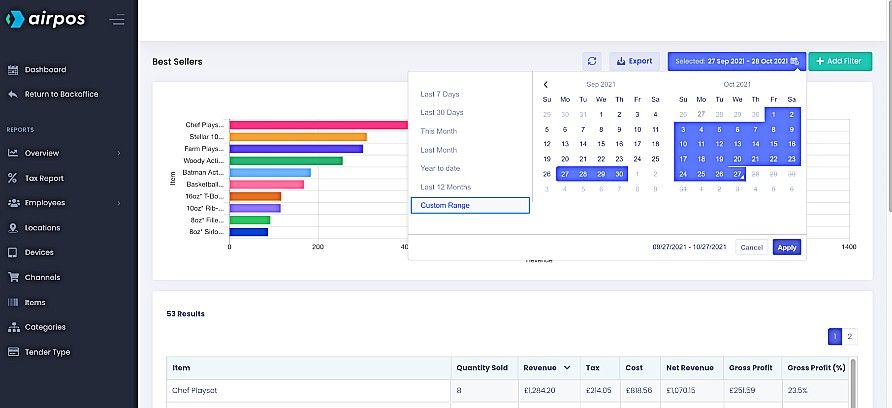
When you click or tap in the date range box at the top of the screen beside the button to 'Export' the data you'll see there are a number of pre-set date ranges such as the last 7 days, the last month, this month etc or you can customise the date range by selecting the dates from the calendars side by side.