How to Use Filters in your Reporting Suite
In your reports section of the backoffice there are a number of tools with which to refine your report. If you click on 'Reports' from the left navigation panel of your backoffice you'll see a screen similar to that below.
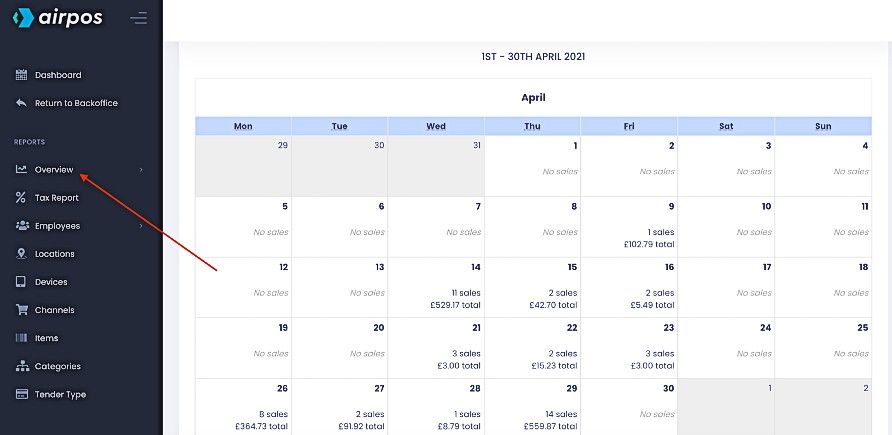
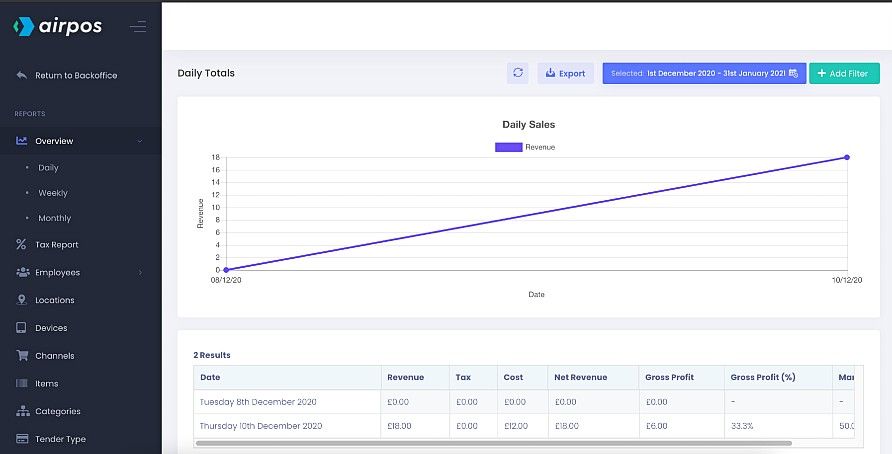
This is the default Dashboard view and shows a calendar view of your sales for the current month. If you click or tap on 'Overview' and 'Daily' below that you'll see a report of your daily sales for the last thirty days. At the top of the screen is a date range box, a button which will 'Export' the data as a .CSV and a green '+ Add Filter' box.
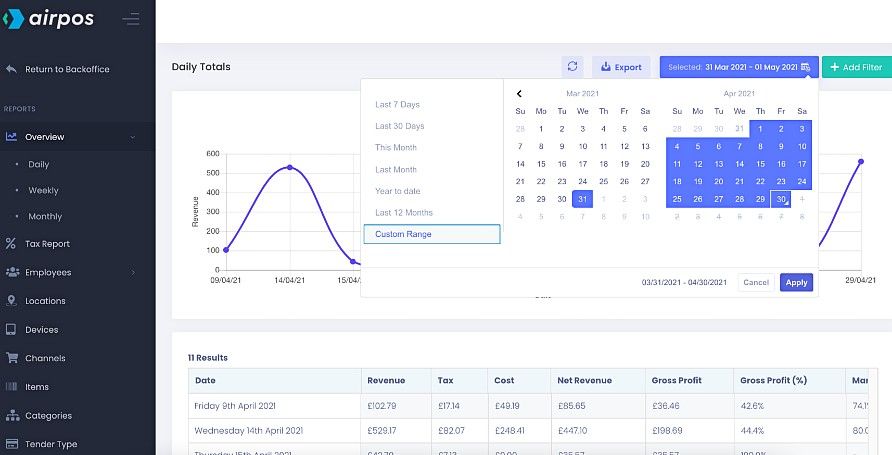
If you click or tap on the date range box you'll see a panel of pre-set date ranges for the last 7 days, the last 30 days, this month, last month, the year to date and the last 12 months. There is also an option to customise the date range if the range you're interested in isn't one of those options.
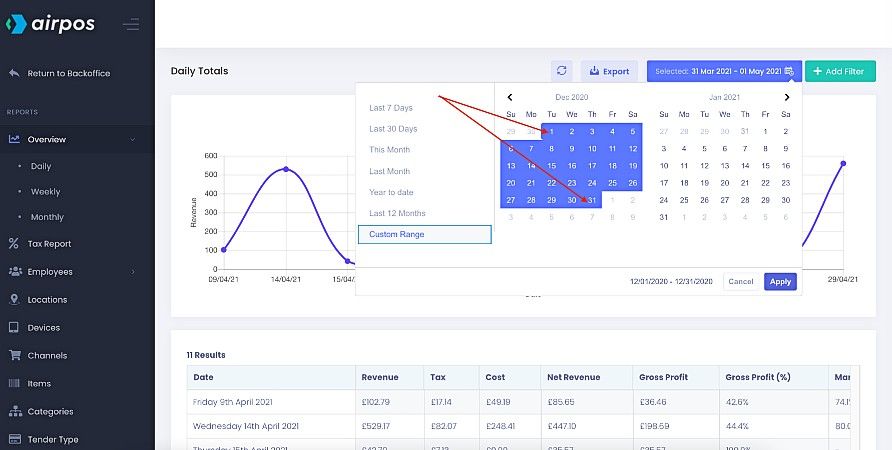
For the purpose of illustration we're going to select the date range of December 2020 and look at the daily sales figures. By clicking on the '<' button at the top left of the calendar you can scroll back to the month you are interested in and then clicking on a start day and a finish day will set the date range and press the 'Apply' button.
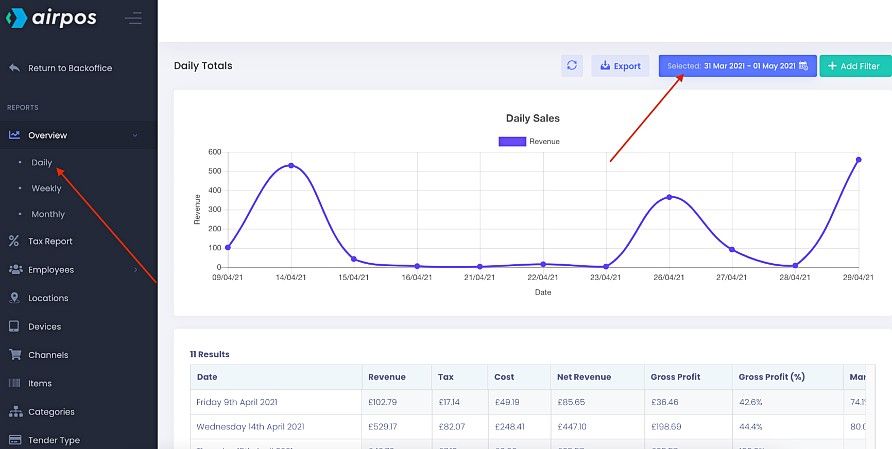
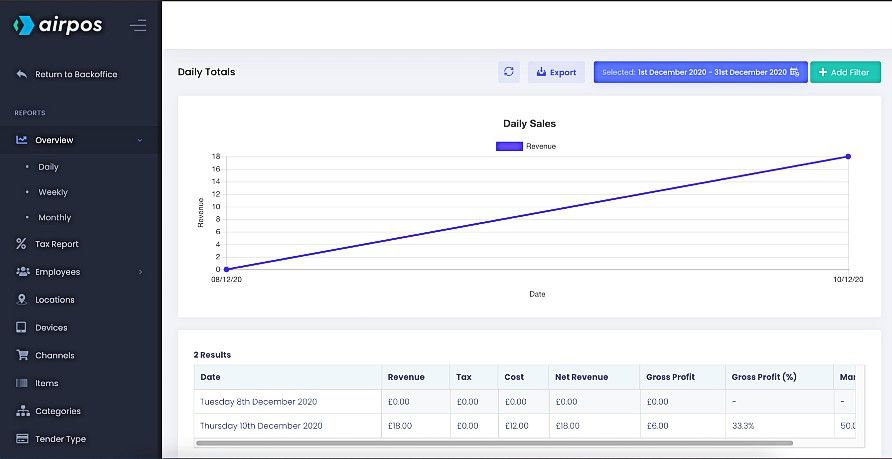
A graphical display of the daily totals for December 2020 will be shown with a table of the data below. This can be exported as a .CSV file by pressing the 'Export' button at the top of the screen.
In the screenshot the date range selected is the from the 1st of December 2020 to the 31st of January 2021.
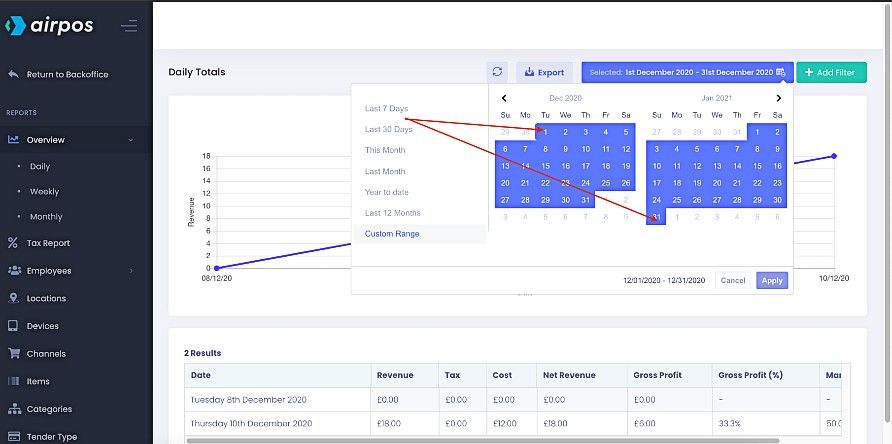
When you press the 'Apply' button after setting the date range you'll see the results displayed graphically and as a table below.
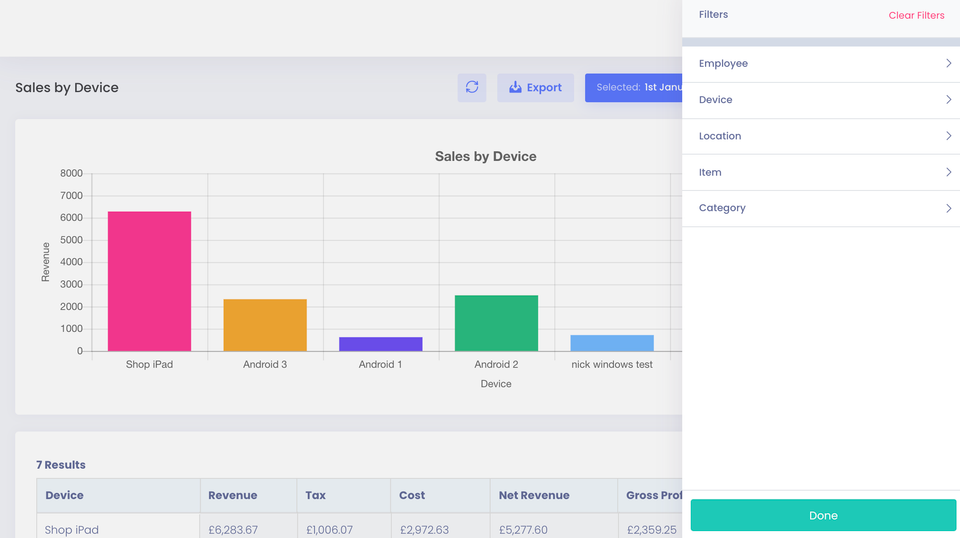
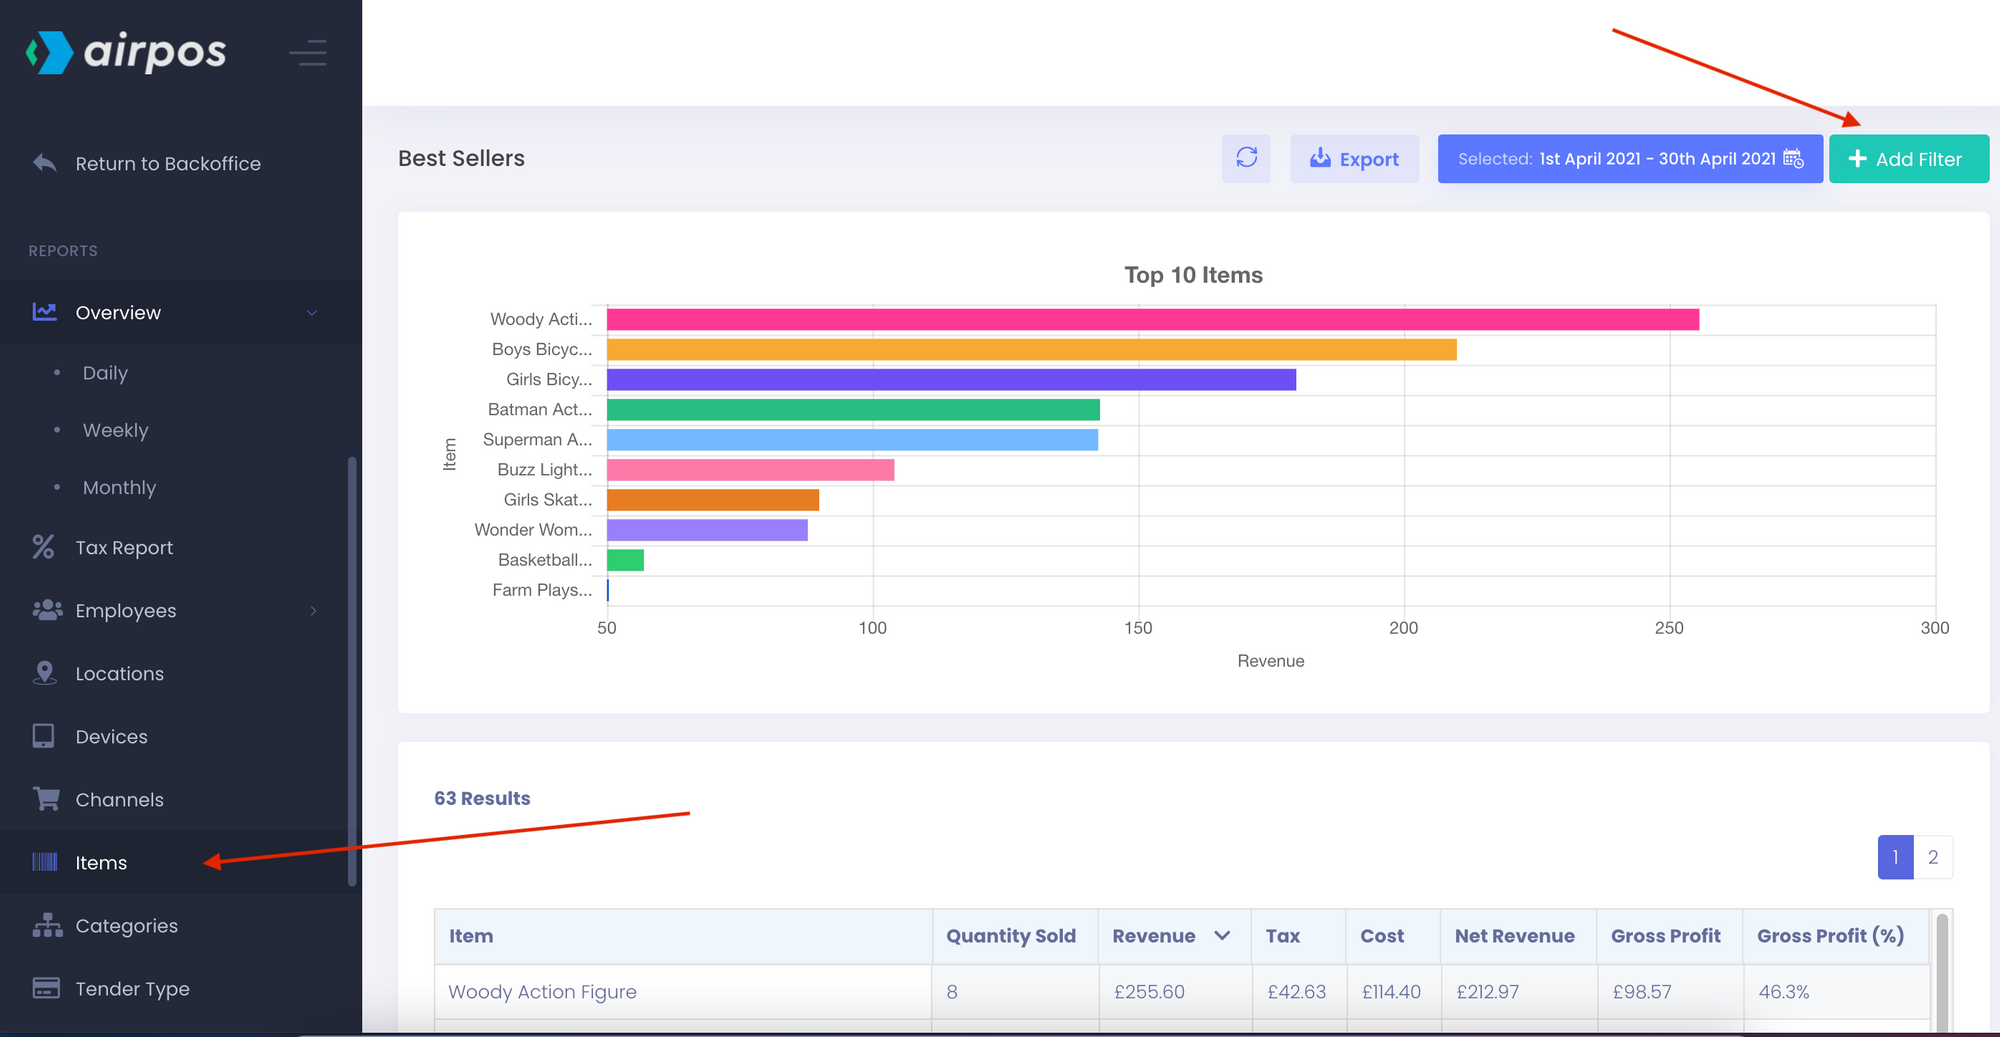
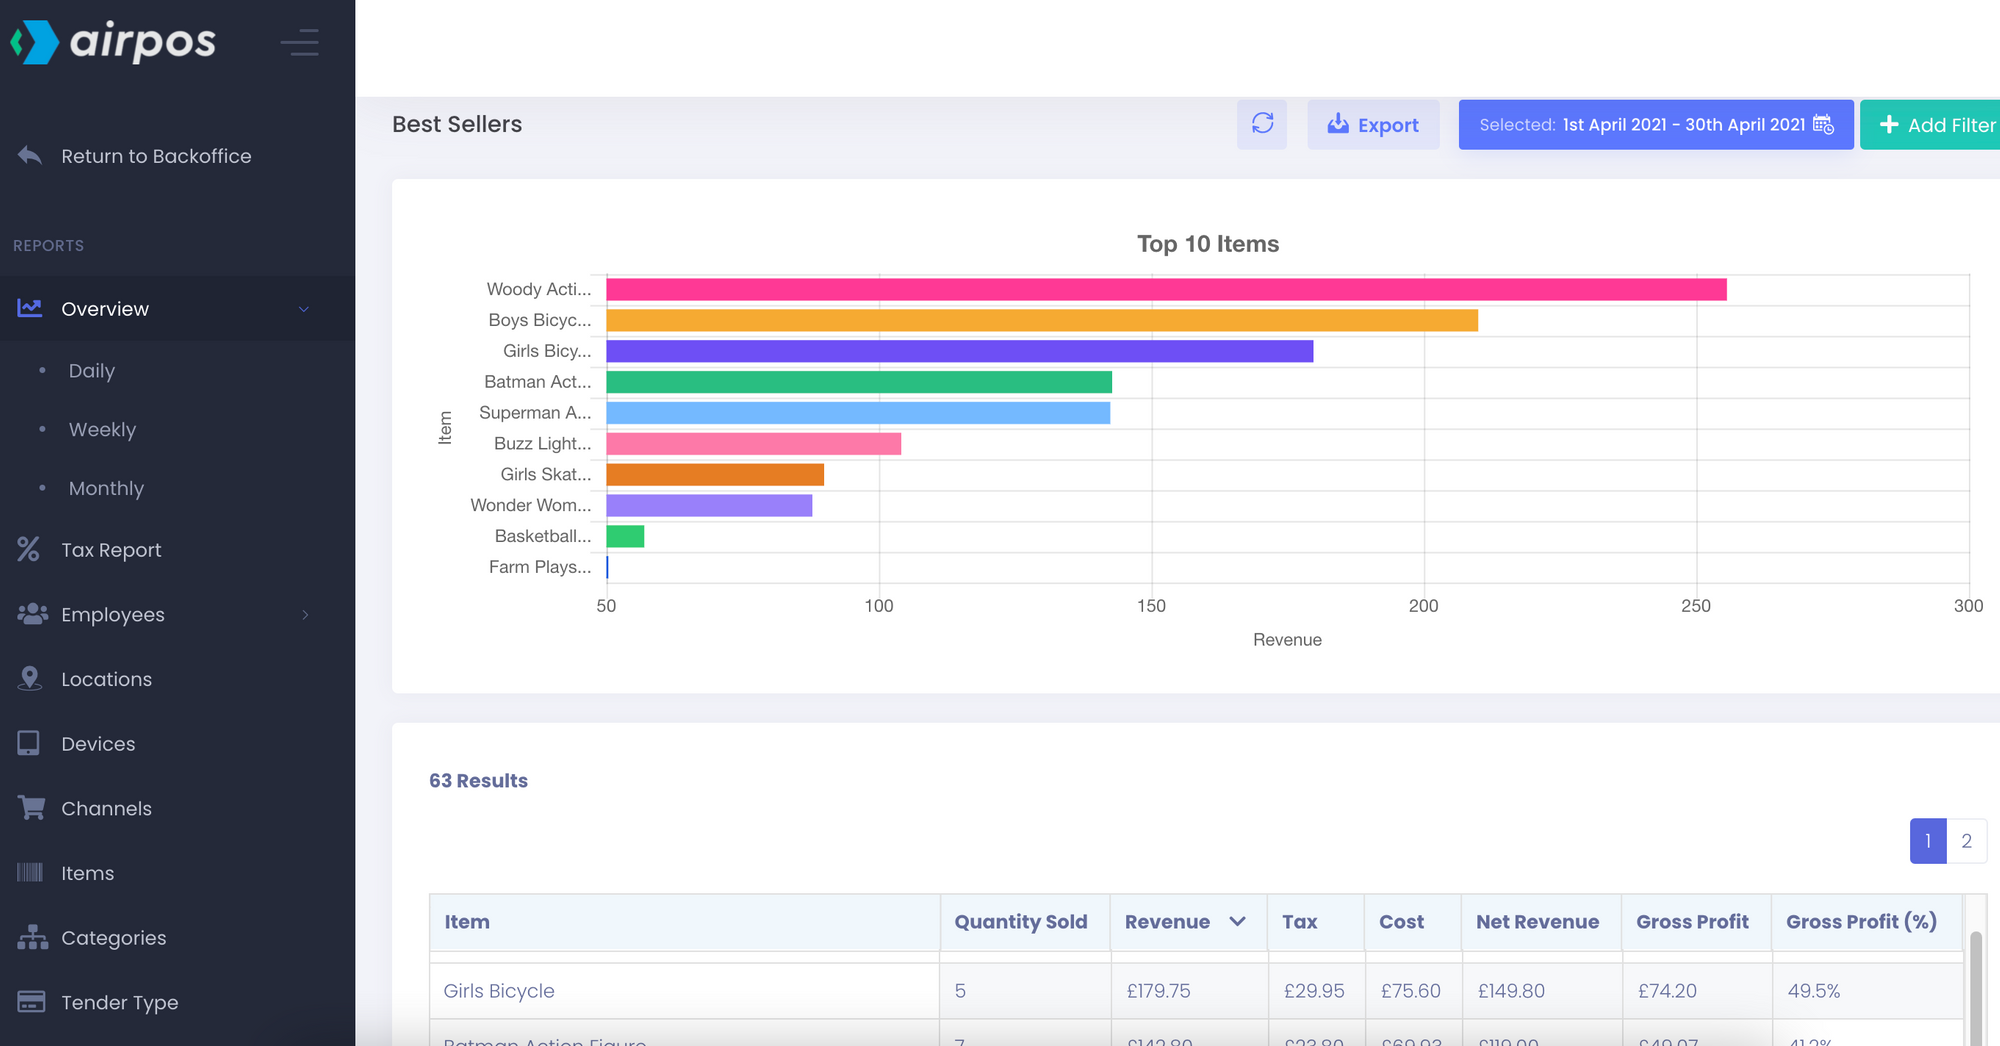
The screenshot below shows a graph of the best selling products across all locations with a table of the sales for all lines below which can be exported as a .CSV file by tapping on the 'Export' button at the top of the screen. The 'Items' report is obtained by selecting 'Items' from the left margin. We may want to see the sales of individual products at a particular location, 84 Adelaide Street, and that is done by tapping on the green '+ Add Filter' button as seen below.
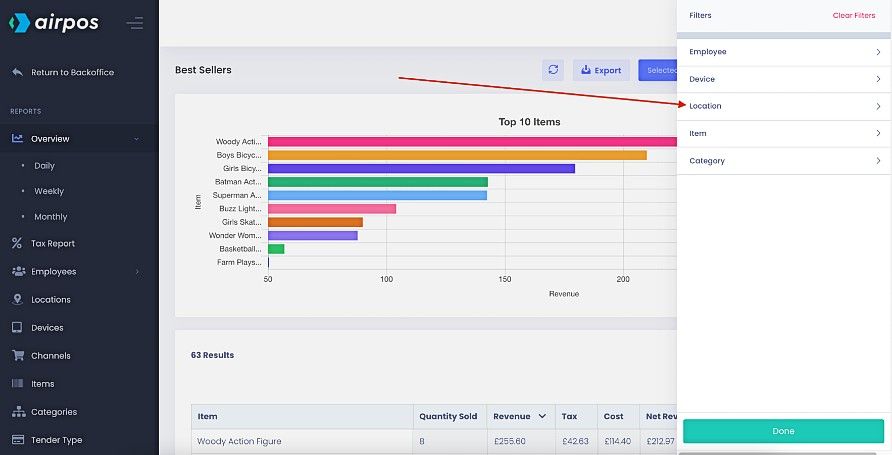
From the dropdown list of available filters select 'Location'.
From the list of available locations select '84 Adelaide Street'.
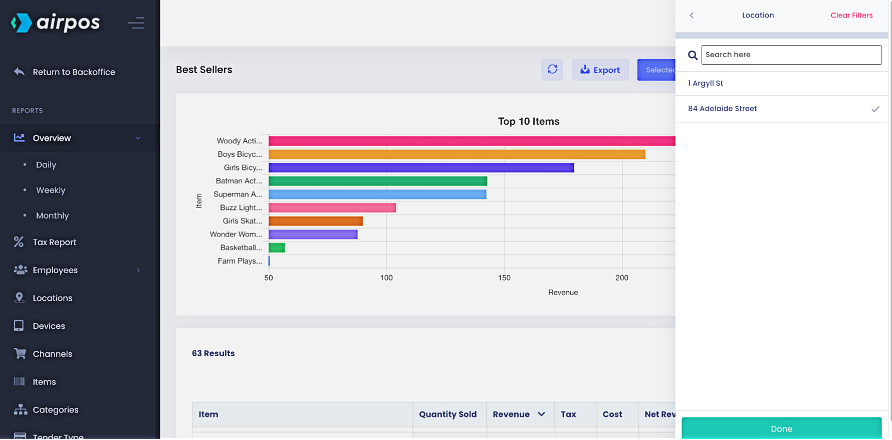
Press 'Done' and the results will show all items sold from the Adelaide Street location in the last thirty days.
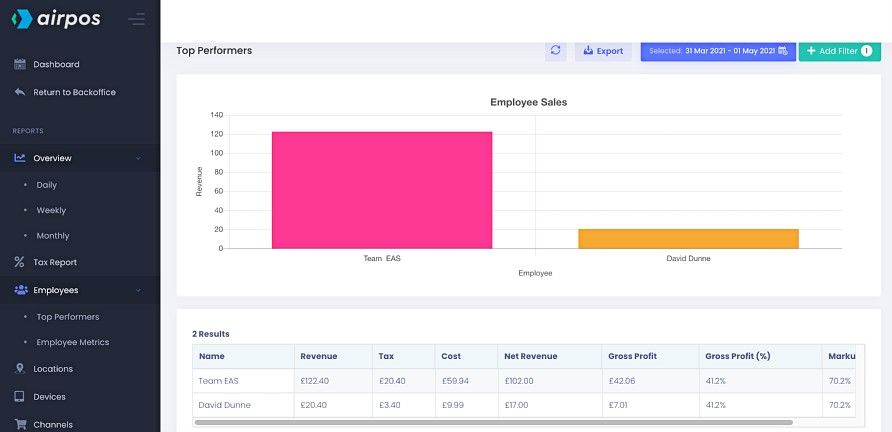
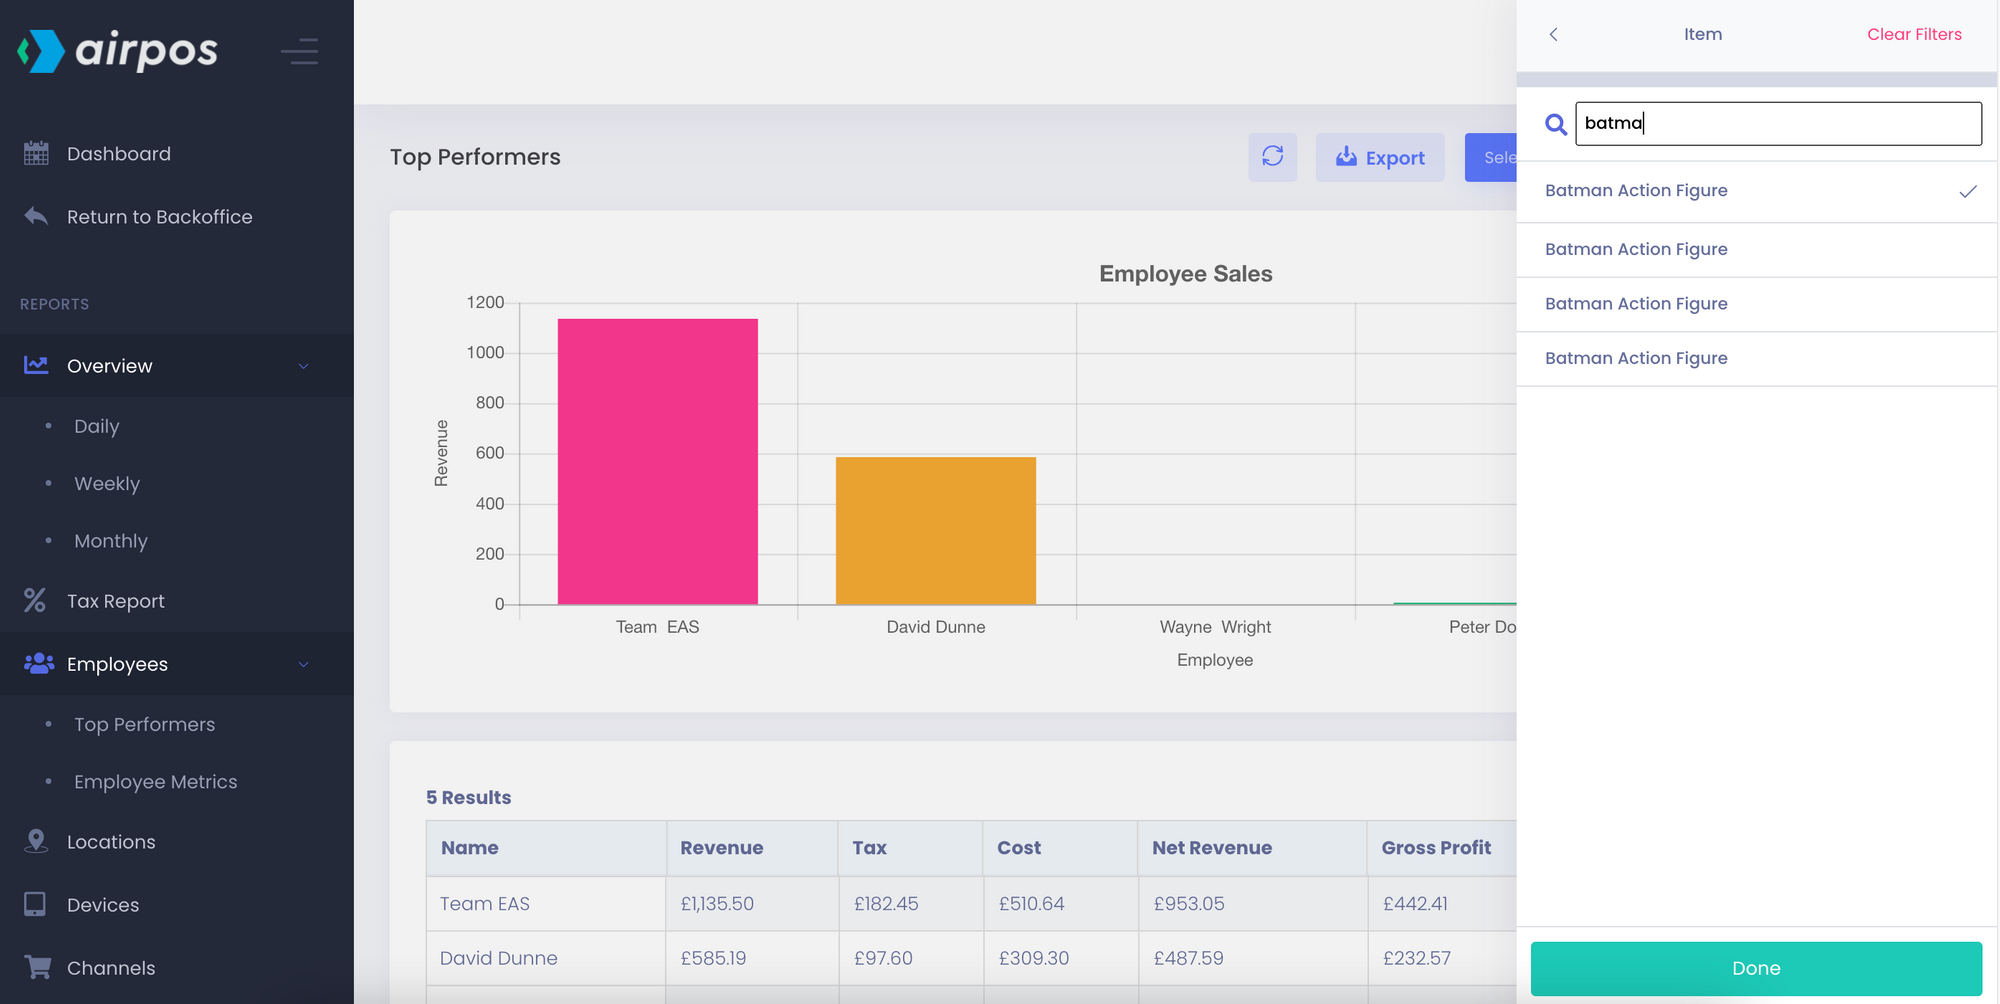
You may be running a promotion on a particular product line and wish to see how your staff are doing selling this particular product for the last 30 days (the past 30 days is the default date range). First click on 'Employees' from the menu in the left margin and select 'Top Performers'. Click on the green '+ Add Filter' button and select 'Item'. Start typing in the name of the product, 'Batman Action Figure' into the search box and the system will search as you type.You'll see something similar to the screenshot below.
When you see the product listed click on it to select it as the filter and press 'Done'. Your results will be displayed graphically and listed in a table of exportable data below the graph.