How to Generate a Report of Your Sales by Category
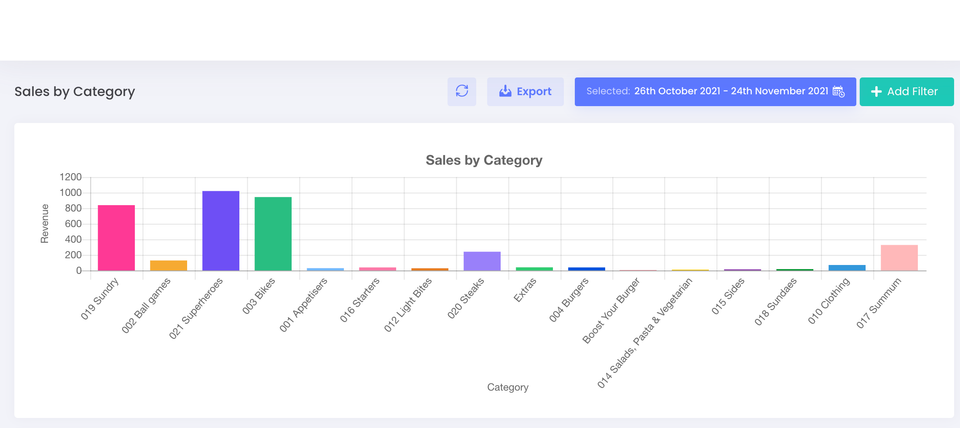
A Report of Your Sales by Category in AirPOS
A visual report of your Sales by Category can be found in the AirPOS backoffice and in the AirPOS Reports App. In the backoffice select 'Reports' from the menu on the left. This will present you with a calendar view of the current month's sales.
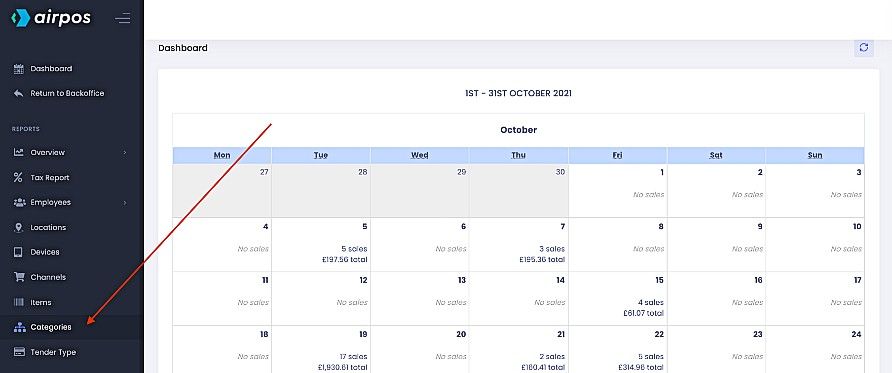
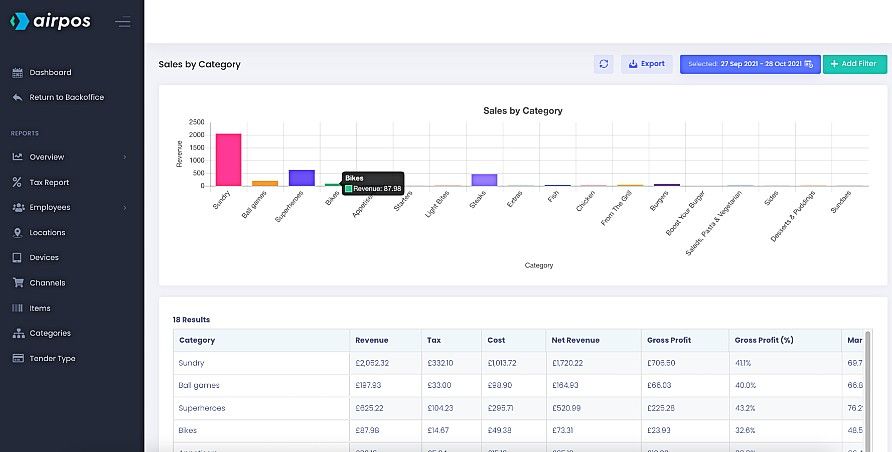
Select 'Categories' from the navigation panel on the left and you'll see a bar chart of your sales by category with a table of the data below which can be exported as a .CSV file by tapping on the 'Export' button at the top of the screen.
It may be that you want to view only your sales by category in one of your locations in which case you can add a filter. As with any of your reports you can add filters to view sales by category for each location, device, employee, item and category. Tap on the green '+ Add Filter' button and you'll see a dropdown list of filter options.
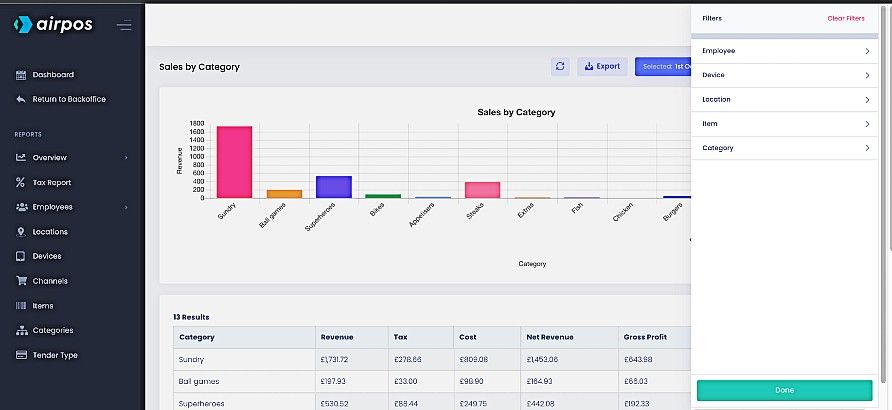
Select the 'Location' option and the list will refine to show your locations.
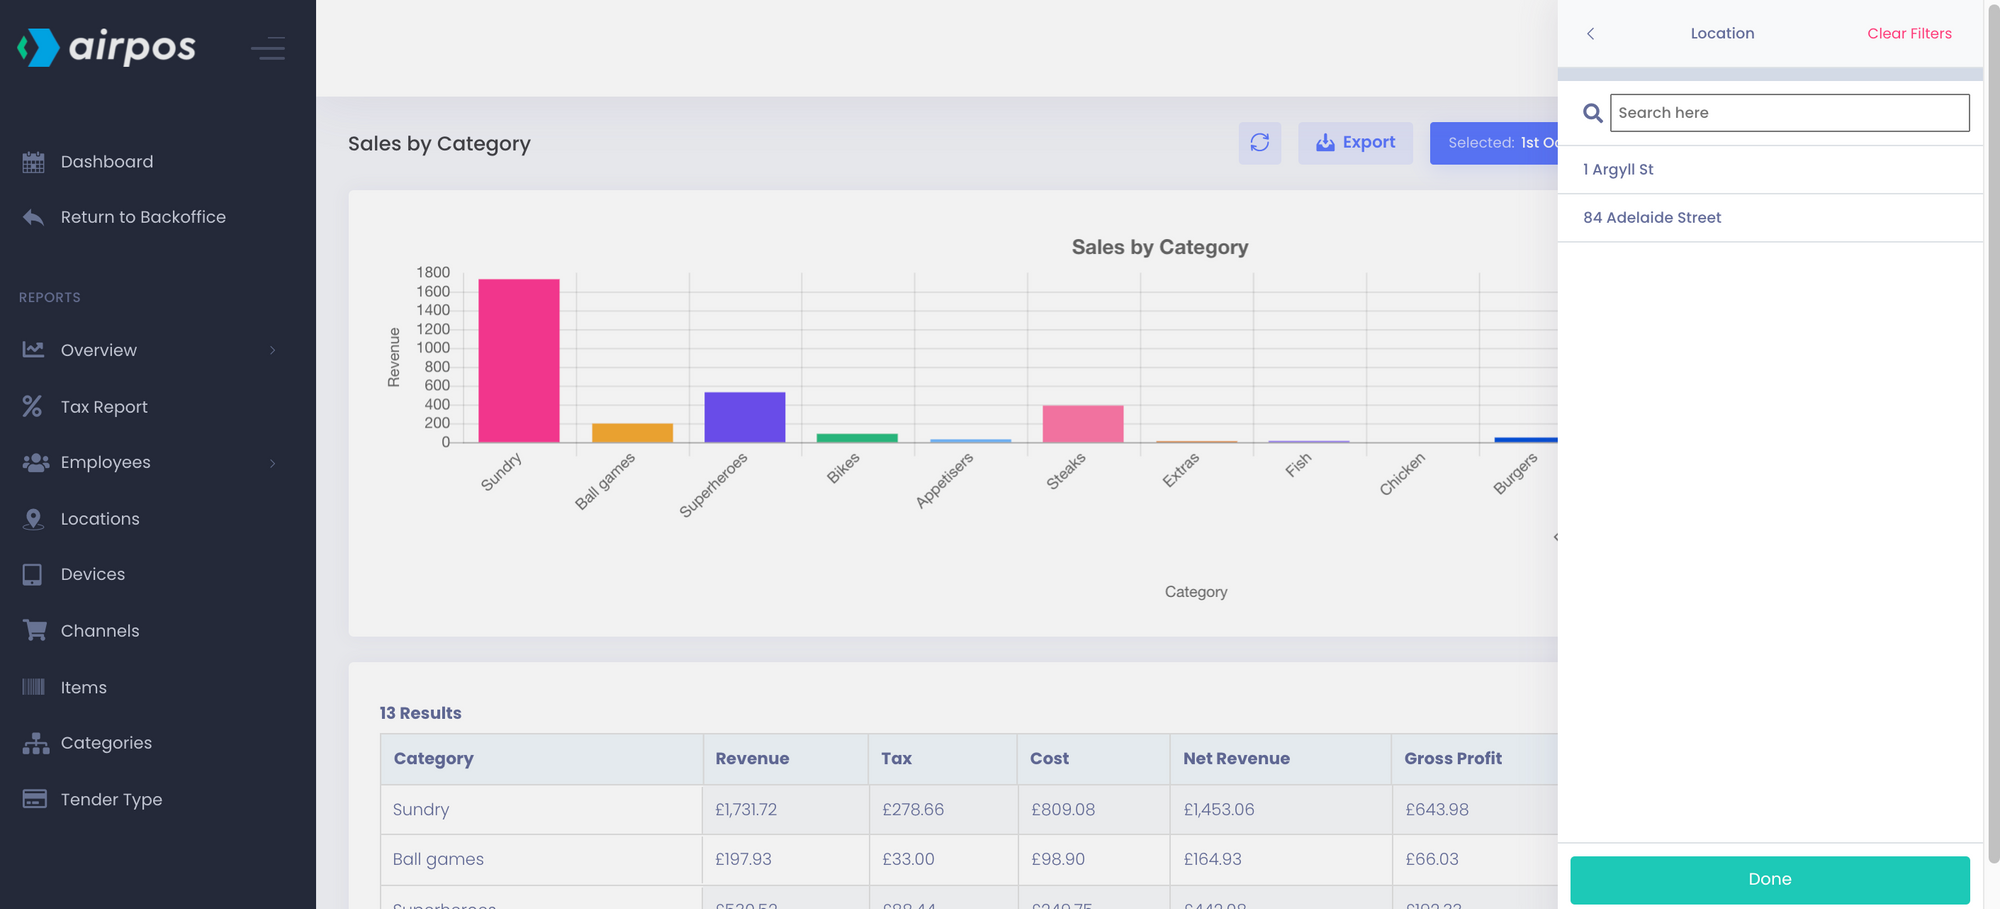
Select the location for which you want the report to run and tap on the 'Done' button
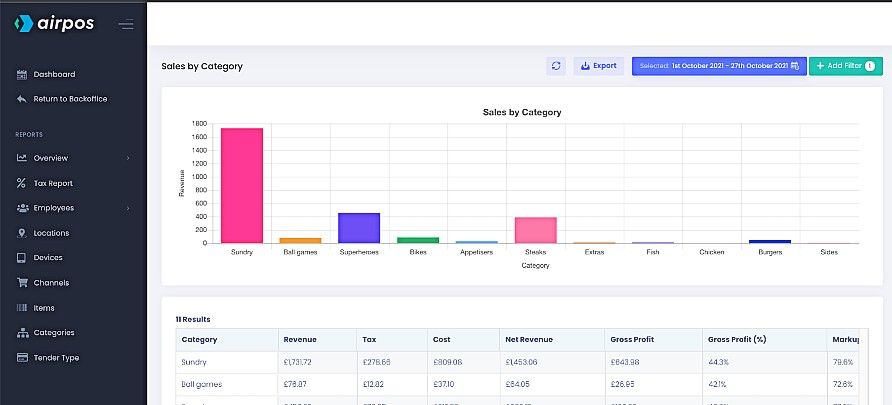
Below the barchart is a table containing the data from your filtered report. This can be exported as a .CSV file by tapping on the 'Export' button at the top of the screen.
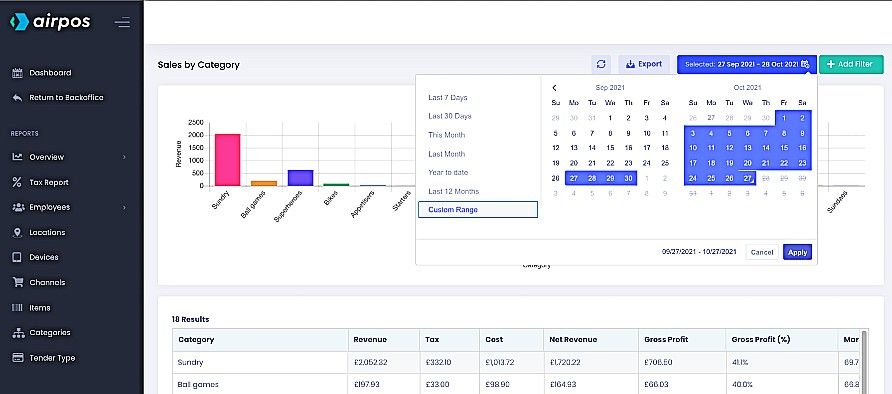
When you click or tap in the daterange box at the top of the screen beside the button to 'Export' the data you'll see there are a number of preset date ranges such as the last 7 days, the last month, this month etc or you can customise the daterange by selecting the dates from the calendars side by side.
